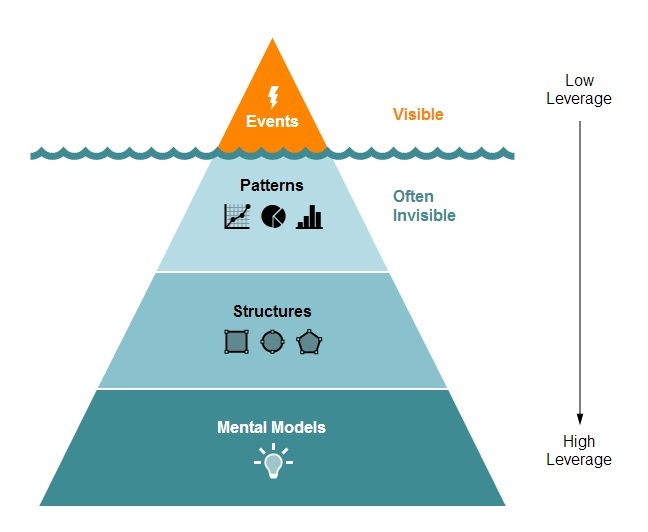
The Iceberg Model
The iceberg is a metaphor often used to show that there is more leverage in changing the mental models that inform the design or structure of a system. The visible ten percent of the iceberg (events or outcomes) is the product of a system’s behavior. The most effective way to alter outcomes or change events is by understanding the 90 percent of the iceberg hidden from view.
Events
In the language of “stocks and flows,” events are stocks or system conditions that we often seek to improve. Because they exist at a point in time, we can usually see them. They are strong signals. But when we intervene at or very close to an event, we are intervening at a place within the system that has the least leverage. Take, for example, the high proportion of New York City high school graduates who enter CUNY schools and who require remediation in literacy and math. The Center for the Urban Future calculated that 74 percent of incoming students place into remediation, and roughly one-third fail the math and writing proficiency exams. All of which suggests that the interventions that we’ve put into place to help students graduate from high school do not sufficiently deepen the skill sets students need to be successful in college.
Patterns
Just below the waterline of our iceberg lie patterns of recurring events; of the invisible iceberg they are the easiest to expose. Events occur over time and thus are by definition “flows.” Flows are activities that change the level of stocks. Longitudinal data, behavior-over-time graphs, and stock-and-flow maps are forms of data that tell us something important about a system’s behavior such as its stability or volatility at certain moments. Patterns help us determine whether growth is sustainable or when our growth potential is nearing its ceiling. These types of data allow us to forecast or anticipate future events and to shed light on whether or not our interventions altered outcomes.
Structure
Think of the parable of the seven blind mice. When the mice approach the elephant individually, they perceive only a part. When you understand that you’ve got an elephant in front of you, and not a fan, or a tree, or a snake, you’re in the position to make coherent, appropriate and strategic decisions about what to do next. As I noted in a previous post, we approach system redesign from what we want to happen (for example, having a clear vision of the attributes of a high performing school) not just what we do not want to see happen (i.e., identifying an attendance problem and redesigning only to eliminate that one problem.)
A wonderful example of system redesign can be found in the book and movie Moneyball (also referenced by Viktor Mayer-Schonberger and Kenneth Cukier, authors of Big Data). Billy Beane, the general manager for the resource-poor Oakland As, understood that trying to solve problems (such as losing star players and needing to replace them) the same way that the resource-rich New York Yankees would, was not feasible. Beane understood that you had to radically redesign the team using an entirely different set of data points and analytic methods. With the right data points, from multiple different angles, and a different mindset, he redefined how baseball teams are designed.
Mental Models
Billy Beane used data and a radically new theory to challenge baseball insiders’ assumptions about how to craft a winning team. At the base of the iceberg are our mental models or assumptions that drive the way we design or connect the elements of the system. Jay Forrester, a leading systems thinker, says this of mental models: “The image of the world around us, which we carry in our head, is just a model. Nobody in his head imagines all the world, government or country. He has only selected concepts, and relationships between them, and uses those to represent the real system.” Mental models are challenged when we test them. Simulations are one way of testing our assumptions or playing out a scenario. An excellent example of a team leveraging simulations is Climate Interactive. This group specializes in environmental issues and has developed multiple simulation tools for policy analysis and scenario testing. For example, they have created a simulation that examines drought and displacement scenarios. The simulation encourages users to play out different scenarios by manipulating key variables such as international assistance, rainfall and land quality.
Right off the bat I can imagine how principals and school leaders would be able to use a programming and scheduling simulator to test different scheduling scenarios for student and school level needs. Well conducted, rigorous program evaluations will also continue to serve as an important mechanism for challenging assumptions and theories of change. Carol Weiss, author of Evaluation, says “evaluation findings often have significant influence; they provide new concepts and angles of vision, new ways of making sense of events, new possible directions. They puncture old myths.”
